
A student finishes every audiobook you assign. Perfect completion rate, right? Not so fast. Finishing a recording tells you almost nothing about whether that student actually engaged with the content, built new vocabulary, or walked away with any lasting comprehension. For learners with dyslexia, ADHD, or visual impairments, this distinction is not just academic — it directly shapes whether your audiobook program becomes a genuine learning tool or a well-intentioned workaround that produces no measurable growth.
Table of Contents
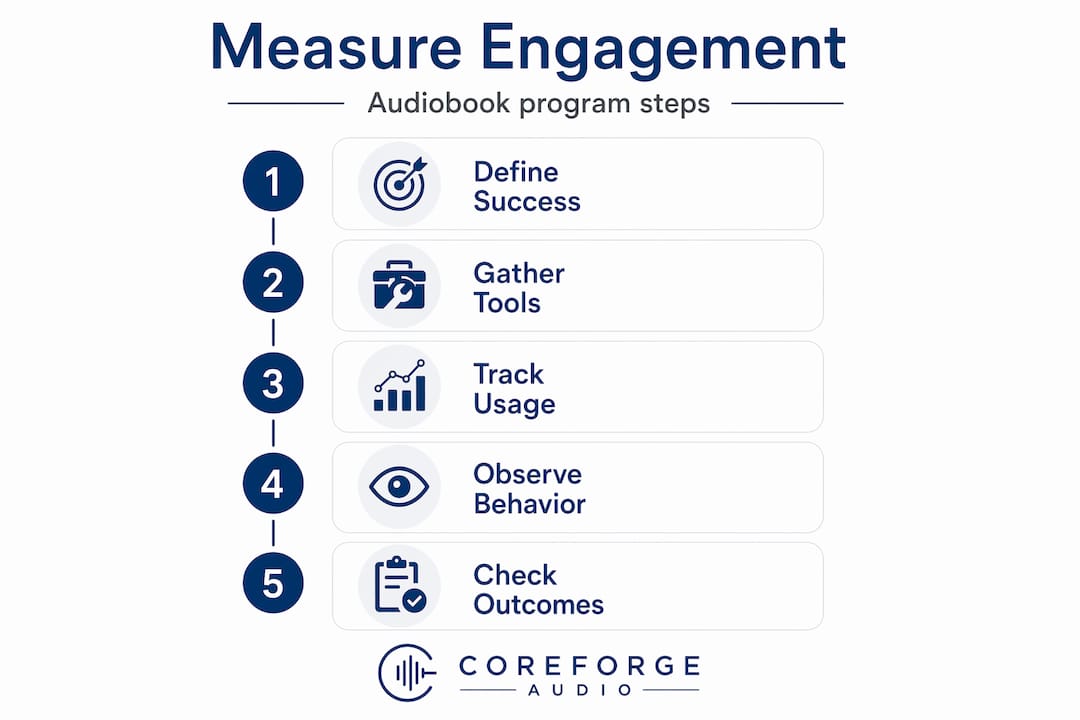
- Gather your tools and define success
- Track usage data and behavior analytics
- Measure learning outcomes, not just access
- Avoid common measurement mistakes
- Our perspective: Why triangulation matters most
- Explore solutions for robust audiobook engagement measurement
- Frequently asked questions
Key Takeaways
| Point | Details |
|---|---|
| Define engagement clearly | Identify the exact behaviors and learning indicators you want to measure before starting any tracking. |
| Blend multiple data sources | True engagement requires analyzing digital usage, observable behavior, and learning outcomes together. |
| Avoid access-only mistakes | Focusing solely on checkouts or listening time is misleading—deeper learning signals matter. |
| Measure impact, not just activity | Track how audiobook participation translates into real gains in comprehension and vocabulary, especially with instructional supports. |
| Adjust methods for neurodiverse learners | Consider initiation, persistence, and qualitative behaviors when measuring engagement for students with dyslexia, ADHD, or visual impairments. |
Gather your tools and define success
Before you can track engagement, you need to agree on what engagement actually looks like for your students. This sounds obvious, but most programs skip this step entirely and end up drowning in data that tells them very little.
For neurodiverse learners specifically, tracking and evaluating student participation requires a broader definition than "did they listen?" A practical way to measure student engagement with audiobook programs is to track observable engagement behaviors over time, including awareness, curiosity, investigation, discovery, anticipation, persistence, and initiation — not only task completion. That list is significant because most school dashboards only capture the last item.
Here are the core tools you will want in place before you begin:
- Observation sheets: Structured checklists that teachers or aides use during listening sessions to note specific behaviors in real time.
- Digital engagement dashboards: Built into most audiobook platforms, these capture minutes listened, books started, books completed, and session frequency.
- Comprehension rubrics: Scoring guides for oral retells, written summaries, or discussion contributions tied directly to audiobook content.
- Survey instruments: Short student self-reports measuring enjoyment, perceived difficulty, and emotional response to what they heard.
The table below shows how each tool connects to specific engagement signals:
| Tool | What it measures | Best used for |
|---|---|---|
| Observation sheet | Initiation, curiosity, persistence | In-class listening sessions |
| Digital dashboard | Minutes, checkouts, streaks | Trends over weeks or months |
| Comprehension rubric | Understanding, vocabulary, recall | Post-listening tasks |
| Student survey | Enjoyment, confidence, stress | Affective engagement signals |
The real power comes from combining all four sources. Behavioral data alone can miss students who are internally engaged but physically still. Digital data alone can miss students who hit play and zone out. Outcome data alone can miss students who struggle with written expression but genuinely understood the content.
Pro Tip: If your students have IEP or 504 plans, map each measurement tool directly to a stated goal. A student whose plan targets vocabulary expansion should have comprehension rubrics that specifically assess new word use. This alignment makes your engagement data immediately actionable and defensible in team meetings.
Track usage data and behavior analytics
With your tools and objectives set, you are ready to start data collection in two parallel streams: digital metrics and in-person observations. Running both simultaneously is what separates a meaningful engagement picture from a misleading one.
On the digital side, platform usage metrics such as minutes read or listened, pages read, and counts of digital checkouts are used to infer engagement at scale. These numbers are easy to collect and easy to misread. A student logging 45 minutes of listening time is not automatically an engaged student. But a student whose daily listening streaks grow steadily over six weeks, who returns to the same title multiple times, and who checks out books in the same genre repeatedly — that pattern tells a genuinely different story.
Here is a step-by-step process for collecting and combining both data streams effectively:
- Set a baseline in week one. Record each student's starting usage metrics and conduct an initial observation session to note current engagement behaviors.
- Schedule weekly observation windows. Designate at least one class session per week where a teacher or aide uses the observation checklist while students listen.
- Pull platform reports every two weeks. Look for trends in session length, frequency, and title variety rather than single-session snapshots.
- Cross-reference the two streams monthly. Flag any students where digital data and observational data tell conflicting stories — this is where the most important insights live.
- Adjust your observation focus based on what you find. If digital data shows a student listening less, shift observation to capture whether they are initiating independently or waiting to be prompted.
The comparison below shows exactly what each stream reveals and where each falls short:
| Data source | Strengths | Blind spots |
|---|---|---|
| Platform analytics | Objective, scalable, consistent | Cannot detect comprehension or enjoyment |
| Classroom observation | Captures curiosity, persistence, initiation | Time-intensive, subject to observer bias |
Engagement measurement in neurodiverse populations should include initiation and persistence, not just attention, because these behaviors can be missed entirely if you track only completion or time-on-task. A student with ADHD who asks to continue listening during free time is showing powerful initiation. That never appears in a usage report.
Pro Tip: Use trends over weeks, not single-session snapshots, to spot real changes. One bad listening day means nothing. A student whose session lengths drop for three consecutive weeks while their observation scores also decline — that is a signal worth investigating immediately.
Measure learning outcomes, not just access
Now that you are tracking engagement, let us look at how to confirm that participation actually translates into learning. Access and engagement are not the same thing, and engagement and learning are not the same thing either. You need evidence at all three levels.

Audiobook-based literacy interventions can improve measurable literacy outcomes when accompanied by scaffolded instructional supports. That word "scaffolded" is doing a lot of work. Students who listen passively without any structured follow-up activity show far smaller gains than students who listen and then retell, discuss, write, or create something connected to what they heard.
Here are the most reliable forms of comprehension evidence you can collect without adding significant burden to your schedule:
- Oral retells: Ask the student to tell you what happened or what they learned. Score on a simple rubric covering main idea, key details, and sequence.
- Written summaries: Even a three-sentence summary after each chapter reveals whether the student processed the content or simply heard it.
- Discussion participation: Track how often a student contributes relevant comments during group discussion of an audiobook. Quality matters more than quantity here.
- Project-based responses: Creative projects, visual maps, or recorded responses allow students who struggle with traditional writing to demonstrate genuine comprehension.
- Vocabulary spot-checks: Ask students to use or define three words from the audiobook in context. This is one of the fastest ways to detect real vocabulary growth.
Listening enjoyment and perceived understanding are survey-measurable outcomes at population scale and can be used as a complementary benchmark for engagement. This matters because a student who reports high enjoyment and low stress while listening is far more likely to sustain the habit long enough to produce measurable gains.
Here is a sample rubric you can adapt for your program:
| Outcome indicator | Beginning (1) | Developing (2) | Proficient (3) |
|---|---|---|---|
| Oral retell accuracy | Recalls one detail | Recalls main idea | Recalls main idea and key details |
| Vocabulary use | Cannot define words | Defines with prompting | Uses words correctly in context |
| Discussion contribution | No relevant comments | One relevant comment | Multiple relevant contributions |
| Self-reported enjoyment | Negative or neutral | Mildly positive | Strongly positive |
The goal is not to turn every audiobook session into a test. The goal is to collect enough varied evidence that you can say with confidence whether a student is genuinely benefiting from the program or simply completing it.
Avoid common measurement mistakes
Understanding what can go wrong helps ensure your efforts lead to meaningful and valid engagement insights. Even well-designed programs fall into predictable traps, and most of them come down to taking shortcuts with data.
The most common mistakes educators make when measuring audiobook engagement include:
- Measuring only time-on-task. Minutes listened is the easiest metric to pull and the least informative one to act on. It tells you a student was present, not engaged.
- Ignoring qualitative behaviors. Observation data feels messy compared to clean dashboard numbers, so teams skip it. This eliminates your best window into initiation and curiosity.
- Failing to tie listening to instructional goals. Audiobooks used as free-choice time produce different data than audiobooks used as a structured instructional tool. Mixing the two contexts produces uninterpretable results.
- Treating accommodation as instruction. This is the most consequential mistake of all.
- Relying on a single data point to make decisions. One strong quiz score or one bad observation session should never drive a program change.
"There is a need to avoid over-attributing gains to 'audiobook accommodation' alone; listening accommodations should be aligned with goals, because listening may reduce urgency for remediation."
That warning is worth sitting with. If students with dyslexia are listening to audiobooks instead of receiving explicit decoding instruction, the accommodation may actually slow their long-term literacy development even while improving their short-term content access. Audiobooks should supplement structured reading instruction, not replace it.
The solution is to combine usage analytics with behavioral observations and comprehension evidence to avoid confusing access with engagement and engagement with learning. All three streams together give you a defensible, actionable picture. Any two without the third leaves a gap large enough to produce real mistakes in student support planning.
Use this quick checklist to audit your current measurement plan:
- Are you collecting data from at least two of the three streams (digital, observational, outcome)?
- Are your metrics tied to specific IEP or instructional goals?
- Are you reviewing trends over multiple weeks rather than single sessions?
- Are you separating accommodation use from instructional audiobook use in your data?
- Are you including student self-report alongside teacher observation?
If you answered no to two or more of these, your measurement plan has meaningful gaps worth addressing before your next reporting cycle.
Our perspective: Why triangulation matters most
Here is the uncomfortable truth about audiobook engagement measurement: the field has a data abundance problem, not a data scarcity problem. Most platforms generate more usage reports than any teacher has time to read. The problem is not collecting data. The problem is collecting the right data and then synthesizing it into something that actually changes what you do on Monday morning.
Triangulation, which means integrating usage data, classroom observation, and learning outcomes into a single coherent picture, is not a fancy research method. It is simply the discipline of refusing to let one number tell the whole story. In neurodiverse settings, this discipline is non-negotiable. A student with ADHD may show low minutes-listened scores because they listen in short, intense bursts rather than long sessions. Without observation data showing high curiosity and initiation, you might incorrectly flag that student as disengaged and pull a resource that is actually working for them.
We have seen programs abandoned because completion rates were low, even though comprehension scores were climbing. We have seen programs expanded because usage numbers looked great, even though students could not retell a single plot point. Both errors come from the same source: trusting one metric too much.
The most meaningful progress we see in holistic engagement approaches comes from teams that build a rhythm of looking at all three data streams together, at least monthly, and asking a simple question: do these three sources agree? When they do, you have confidence. When they conflict, you have your most valuable learning opportunity.
Pro Tip: Revisit your engagement indicators at least once per semester. Technology changes, student needs evolve, and curricula shift. An observation checklist built around one platform's features may become obsolete when your school adopts a new tool. Keep your measurement framework flexible enough to grow with your program.
Explore solutions for robust audiobook engagement measurement
For readers ready to take the next step in systematic engagement measurement, here is what to explore next.
At CoreForge Audio, we built our platform with educators like you at the center of every design decision. We understand that measuring engagement for students with dyslexia, ADHD, or visual impairments requires more than a usage dashboard — it requires tools that reflect how these learners actually interact with audio content.
The CoreForge Audio platform integrates accessibility features like dyslexia-friendly fonts, adjustable narration speeds, and multilingual support directly alongside engagement-oriented design. Our approach supports educators in building observation frameworks, tracking meaningful participation signals, and connecting audiobook use to real instructional outcomes. Whether you are designing a new program or strengthening an existing one, we invite you to explore how a purpose-built accessible audiobook platform can make your engagement measurement more reliable, more equitable, and more useful.
Frequently asked questions
What is the most accurate way to measure student engagement in audiobook programs?
The most accurate approach combines usage analytics with behavioral observations and comprehension evidence, because each source reveals dimensions of engagement the others cannot capture alone.
How can I tell if audiobook engagement leads to improved literacy?
Monitor vocabulary and comprehension gains alongside usage data. Audiobook literacy interventions produce measurable outcomes when paired with scaffolded instructional supports, so look for growth in retells, discussion quality, and vocabulary use over time.
Why shouldn't I rely solely on minutes listened or pages read as engagement metrics?
Minutes and pages only confirm access, not learning or enjoyment. Listening accommodations should align with explicit instructional goals, because high usage numbers can coexist with zero comprehension growth.
Are there specific engagement behaviors I should observe in neurodiverse students?
Yes. Beyond task completion, look for initiation, persistence, anticipation, and curiosity. Engagement in neurodiverse populations is best captured through behavioral observation because these signals rarely appear in platform analytics.